
Did you get The Memo?
February 23, 2024
Thanks to all readers of this blog for the loyal support. Our newsletter The Memo has launched on Substack! As a result we will no longer update this page. To continue having access to great content, be sure to subscribe to the right of this page or at the new location:
https://pyramatrix.substack.com/
ESH24 – Technical Chart
February 12, 2024
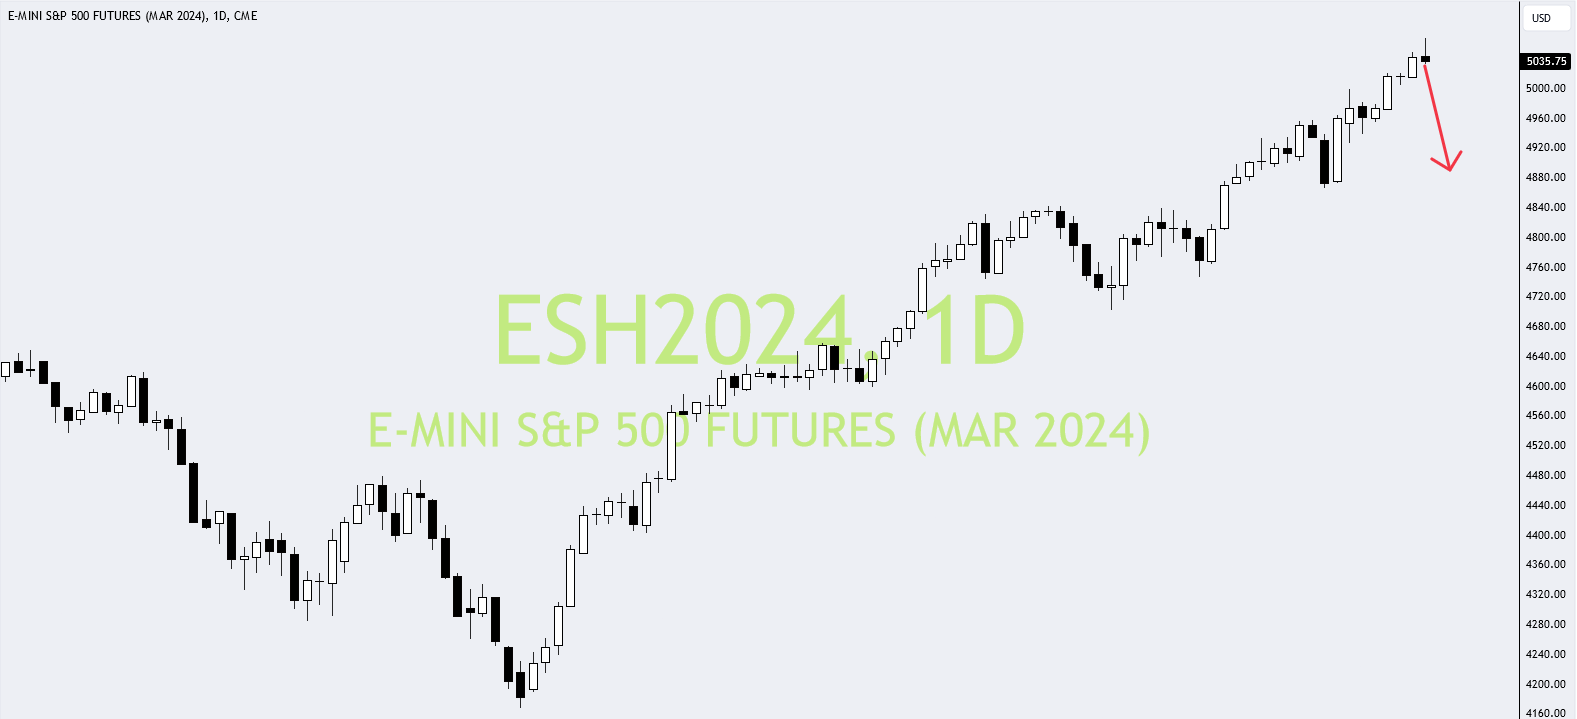
PTGai Signaling a Size Move LOWER This Week
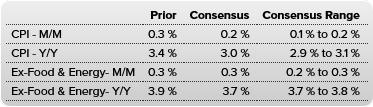
A MOVE LOWER IS IMMINENT ON CPI release on Tuesday. We are expecting a way hotter than expected CPI number that will trigger risk OFF this week and in turn dash hopes of a March rate cut. It will create a scenario wherein the FED will have to delay its timeline. We have closed out all long positions after having been bullish for several months. Dominant cumulative volume is BEARISH and larger timeframe sellers (BIGS) detected Monday building shorts. Anticipating a high energy selloff and we will lock in intraday for real-time reads/entries. We have switched our short term outlook today to very bearish.
2/13/24 CPI 8:30 am EST:
Short Term Outlook: VERY BEARISH
Short Term Price Target: 4990.75
Long Term Price Target: TBA
WTI Crude Oil – Technical Chart
December 26, 2023
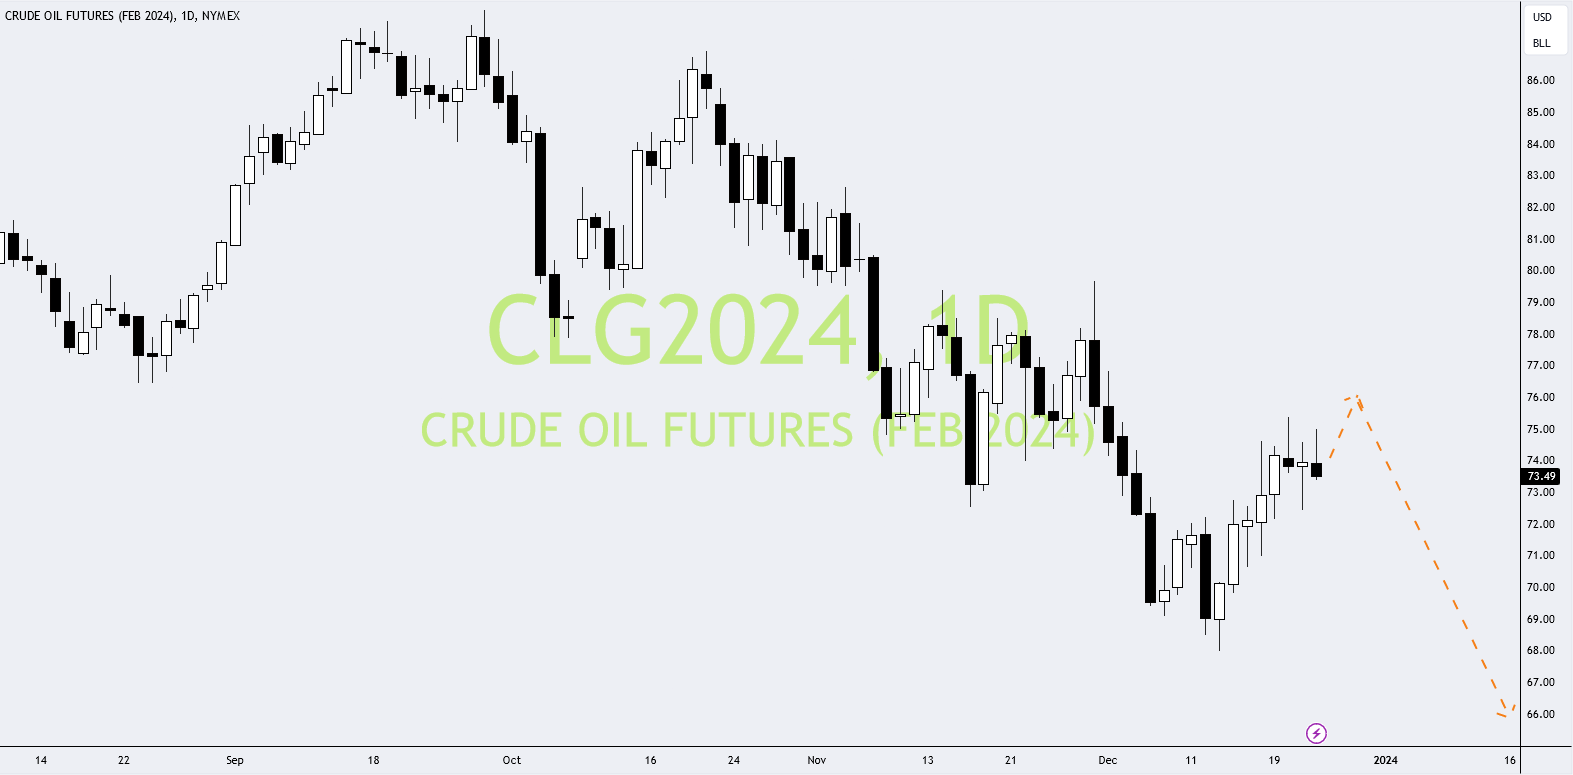
Crude Oil Has More Downside
The short term outlook for WTI crude is STILL very bearish and volume analysis on CLG24 (WTI) suggests that price is being propped up here. There is liquidity detected in the 75.75 – 76.50 area where sellers may take it and resume control. Anticipating further drop in oil prices to continue into the new year. U.S. oil production is at record highs and there is a supply build up from too many non-OPEC+ producers. Growing exports against the backdrop of weakening global manufacturing conditions are bearish for the short term price of oil. This is NOT yet priced in to WTI. It’s safe to say that the production cuts failed and the implications of that far outweigh geo flare-ups in the Red Sea. Saber rattling can ratchet up fear but the facts here must overide the perceptions. This situation is fluid and despite the recent ship attacks, there is confirmation that the multi-national security initiative Operation Prosperity Guardian (OPG) is set up, deployed, and in effect to restore and allow passage through the Suez Canal.The macro outlook has to be respected here. It is likely that demand weakness will outweigh these potential disruptions and reveal itself in lower oil prices in the upcoming weeks along with negative seasonality. With crude in contango, it is signaling that the market has become oversupplied and inventories will build up into the new year. Note also that COP28 resulted in a historic and symbolic agreement that marks a sea change that even big oil execs are accepting. Renewable energy is currently checking the oil industry and pressing hard for a new global trend. Angola’s is not a large player but their decision to quit the cartel only weakens the solidarity of the group. It could set the precedent for other African nations to follow. With Brazil newcomers joing the group, it’s not a good look for OPEC+ to lose its grip here. The target price for CL into the new year is 64.50 – 66.25.
Short Term Outlook: VERY BEARISH
Short Term Price Target: 71.05
Long Term Price Target: 64.50
ESZ23 – Technical Chart
September 13, 2023
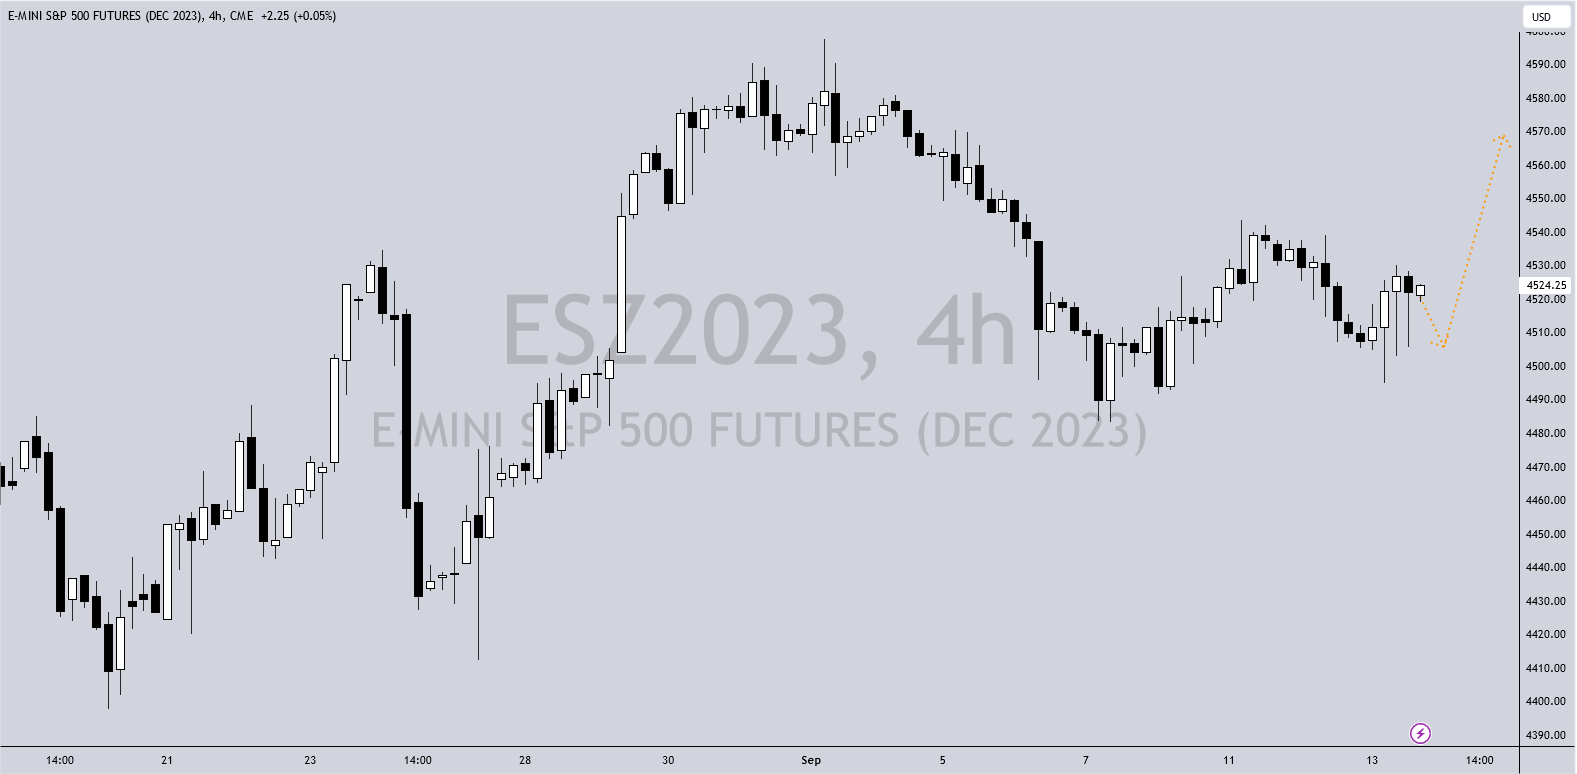
Anticipate a Market Move Higher This Week
Anticipating continued UPSIDE in ES futures here. PTGai is signaling a MOVE HIGHER IS IMMINENT, likely into FOMC. Dominant cumulative volume is BULLISH and larger timeframe buyers (BIGS) are postioning long. Intra-day sweeps to the downside have been trapping traders and catching them offsides. Volume reads have detected LARGE LOT buyers today. 4570/es is a high volume node that is our upside target. The secular bull market, for now remains intact. If ECB pauses on Thursday after a long series of rate hikes, that would signal stronger confidence that inflation is being contained. We believe that Retail Sales will be better than expected, showing a strong consumer. THIS is what market participants have been waiting for to switch big buy algos ON.
9/14/23 PPI 8:30 am EST:
Short Term Outlook: VERY BULLISH
Short Term Price Target: 4570.50
Long Term Price Target: 4660.25
MULN – Technical Chart
December 26, 2022
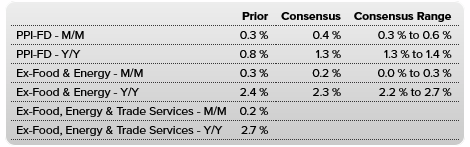
Is Mullen Auto Preparing to Compete with Tesla?
Mullen Automotive is an American company that manufactures and distributes electric vehicles (EV). It also operates CarHub, a digital platform that leverages AI to offer an interactive solution for buying, selling, and owning a car. They also provide battery technology and emergency point-of-care solutions. The EV sector is littered with companies that have recently promised huge and disappointed early investors. The Nikola debacle and Kandi Motors are two examples of this. Mullen is reducing greenhouse gas emissions by using Lithium-Sulfur batteries that use the same manufacturing equipment as Lithium-Ion, but with simpler steps and a smaller factory footprint, which means less than half the cost to manufacture by using low carbon materials like Sulfur made from by-products of recycling oil refinement instead of heavily mined rare earth metals. The water-based cathode means no rare metals are used. The sulfur utilized is sustainably sourced, fully recyclable, ubiquitously available, and inexpensive. In the area of design style, they surely have TSLA beat.
For now the macro trends for the sector as a whole have been under pressure due to higher interest rates, the 2022 capital flight, the pandemic, supply chain issues, and fear of impending recession. MULN stock price (.23) is also tethered to its sector performance and its gravytrain, Tesla. This price action is common in the infancy of any industry. With EV adoption still being in its early stages and unfolding slower than expected, it has gotten beaten down all year. We see MULN stock as a short term, spec trade given its volatility and lack of instituional shareholders. Trading is dominated mostly by retail investors and volume right now. The most important investor question is are they forming a legitimate, long term automotive company or is this a sketchy, short term exit play for founders and insiders (see Nikola)? We are at a stage where the true EV players in the space are alongside concept companies. Currently they have not turned a profit and are avoiding further stock dilution that could resolve this big question. Remember that investing is at it’s core being able to define true value as it relates to its current price and then buying or selling that imbalance accordingly. The current reality is that MULN has a huge short interest with $58m+ shares short. We are seeing volume signals for a HUGE short squeeze given that type of exposure alongside a PTG buy signal. The .18-.22 area is a huge price floor and maybe the location where larger buyers/smart money may be eyeing the opportunity to get involved, given the huge discount from its 2022 high of $4.18. With that, the i-Go begins shipments to hit roads in Europe this week as Mullen moves forward. Could they be the Sampson to Tesla’s Goliath given all the distractions Musk is experiencing? Mullen for now is still a darkhorse that is hugely undervalued here at the .20-.24 price given recent developments and progress. The risk to reward at this price is now favorable and likely to see big upside from here.
Short Term Outlook: VERY BULLISH
Short Term Price Target: .46
Long Term Price Target: 1.02
NDX – Technical Chart
August 2, 2022
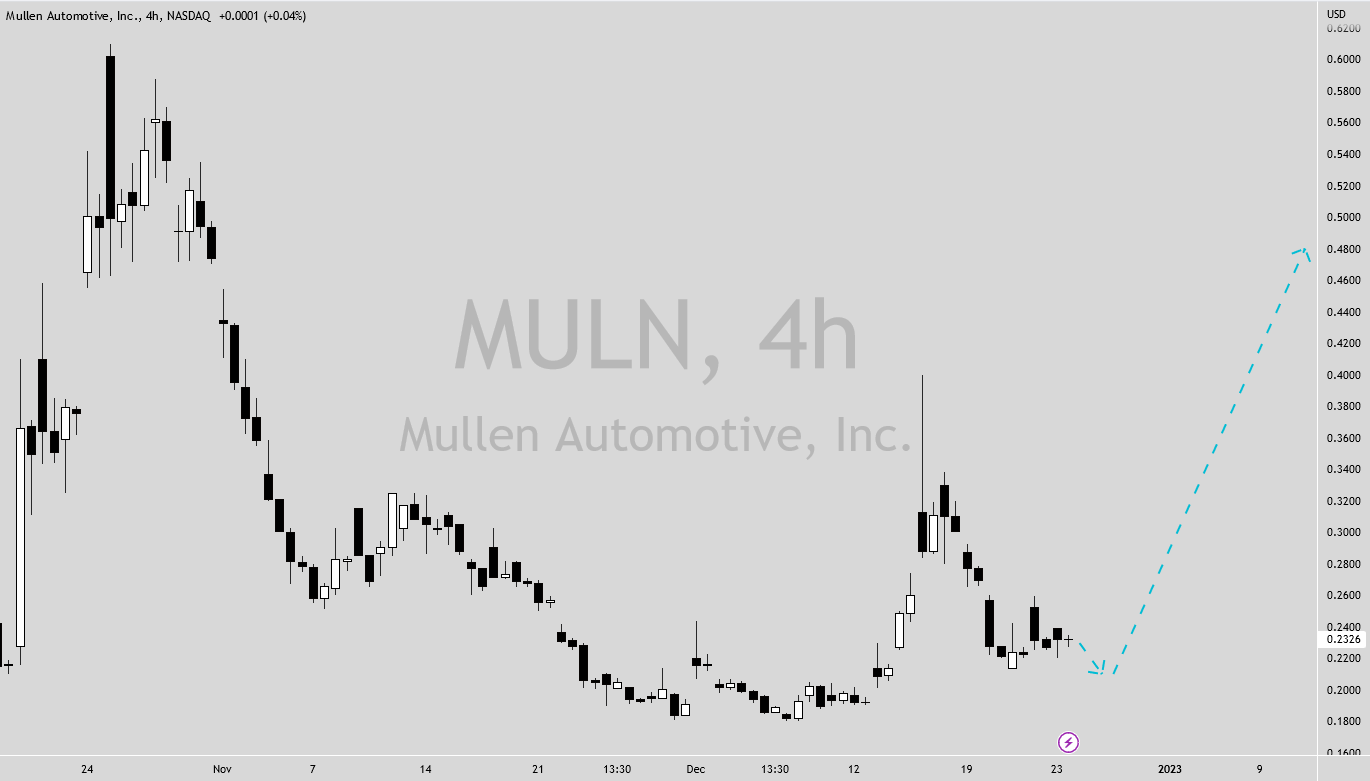
Nasdaq Selloff is Imminent
Market participants divided here on if this is a minor short squeeze due to bank and tech earnings being “less worse“ than expected OR the beginning of a longer timeframe move higher. While many focus on the classic criteria that puts us in a recesssion, the greater concern is whether participants “perceive” that the FED is containing inflation through ongoing policy action. Perception moves the market, not reality. Some well known billionaires have recently gone on record saying a stock market crash is already in progress. How will they respond if they get it wrong? PTGai has detected large lot sell liquidity in the 12980-13175 area and anticipating a small selloff from here. The NFP data on Friday will likely inject some reality into this current move. Expect a jump in market volatility as there will be new sellers attempting, having missed the move down last quarter. Our projected target for this move lower is 12065.
SHORT TERM OUTLOOK: Bearish
*UPDATE 9/01: Downside target hit and PTGai has reset to neutral here
TSLA – Technical Chart
May 24, 2022
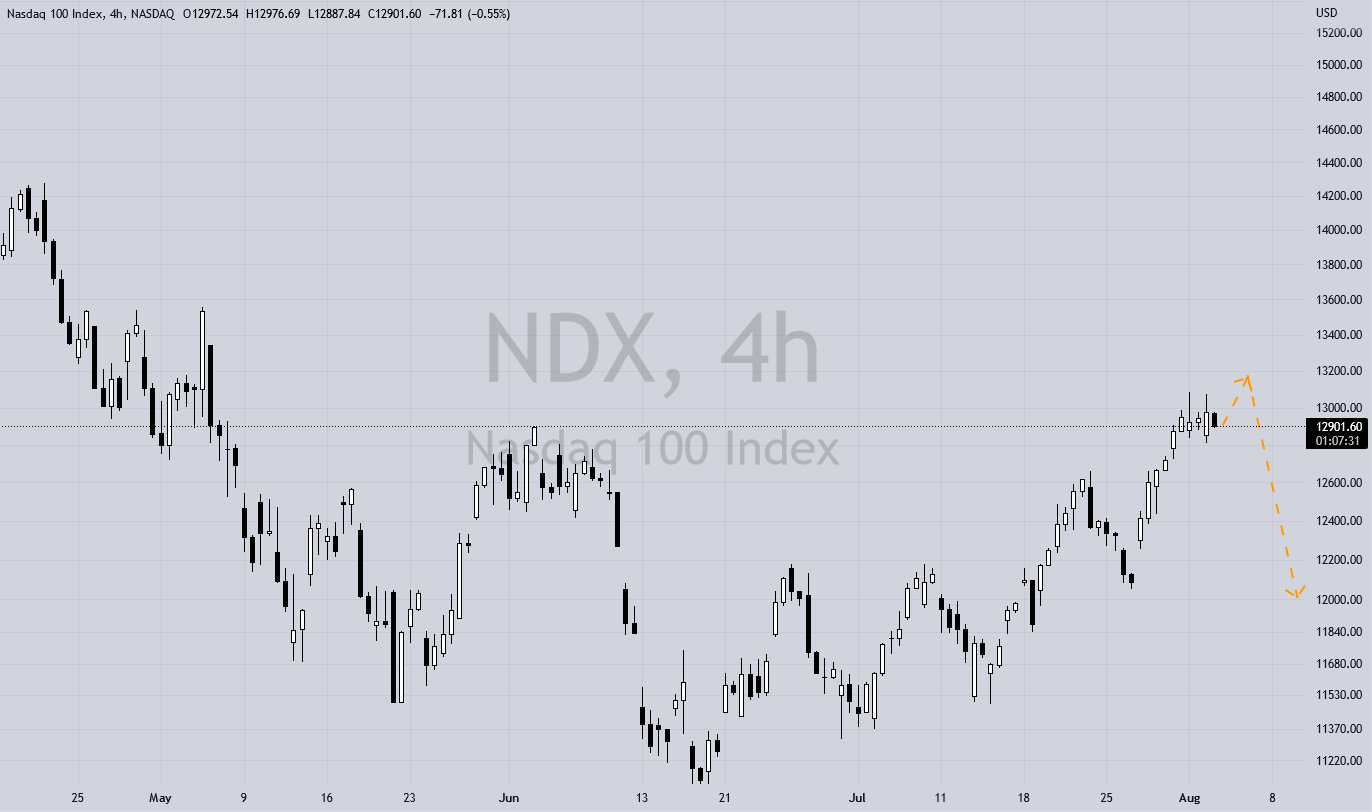
TSLA is a STRONG Buy
PTGai has moved away from neutral and has now triggered a SHORT TERM BUY. Our analytics show a short term low is likely in here at 629.25. Fundamentals aside, Elon Musk has self appointed himself as the brand for Tesla, whether investors know it or not. The company’s stock price is now levered partially to his name and reputation. Fair or unfair, the scandals have accelerated the selloff to our downside target, signaled in March. SEC charges, news of rampant racism at Tesla and sexual harassment allegations at SpaceX are all a PR nightmare. Is there no one in Musk’s inner circle that is curbing his sophomoric tweeting habits and rebel antics? It seems he has an opinion on too many topics outside his lane. How does trolling high profile politicians and creating unnecessary enemies further the vision for intelligent machines and being an interplanetary species? It is obvious to investors now that Musk is too thinly spread across ambitious, generational projects. Time is limited regardless of genius and Twitter is a vanity acquisition that takes focus away from Tesla, SpaceX, and Neuralink. The positive? OOur model has TSLA at a strong BUY here with large lot players detected on the buy side. Despite the major supply chain constraints and delays in China, Tesla earned $3.6B vs. $2.6B in profit on a massive $18.8 billion in total sales for the recent Q1 2022. There is no denying it was a HUGE beat considering the macro environment and with the stock in the low 600’s we see value here. Short term upside target is 1002.50-1004.
SHORT TERM OUTLOOK: Bullish
SP 500 – Technical Chart
May 16, 2022
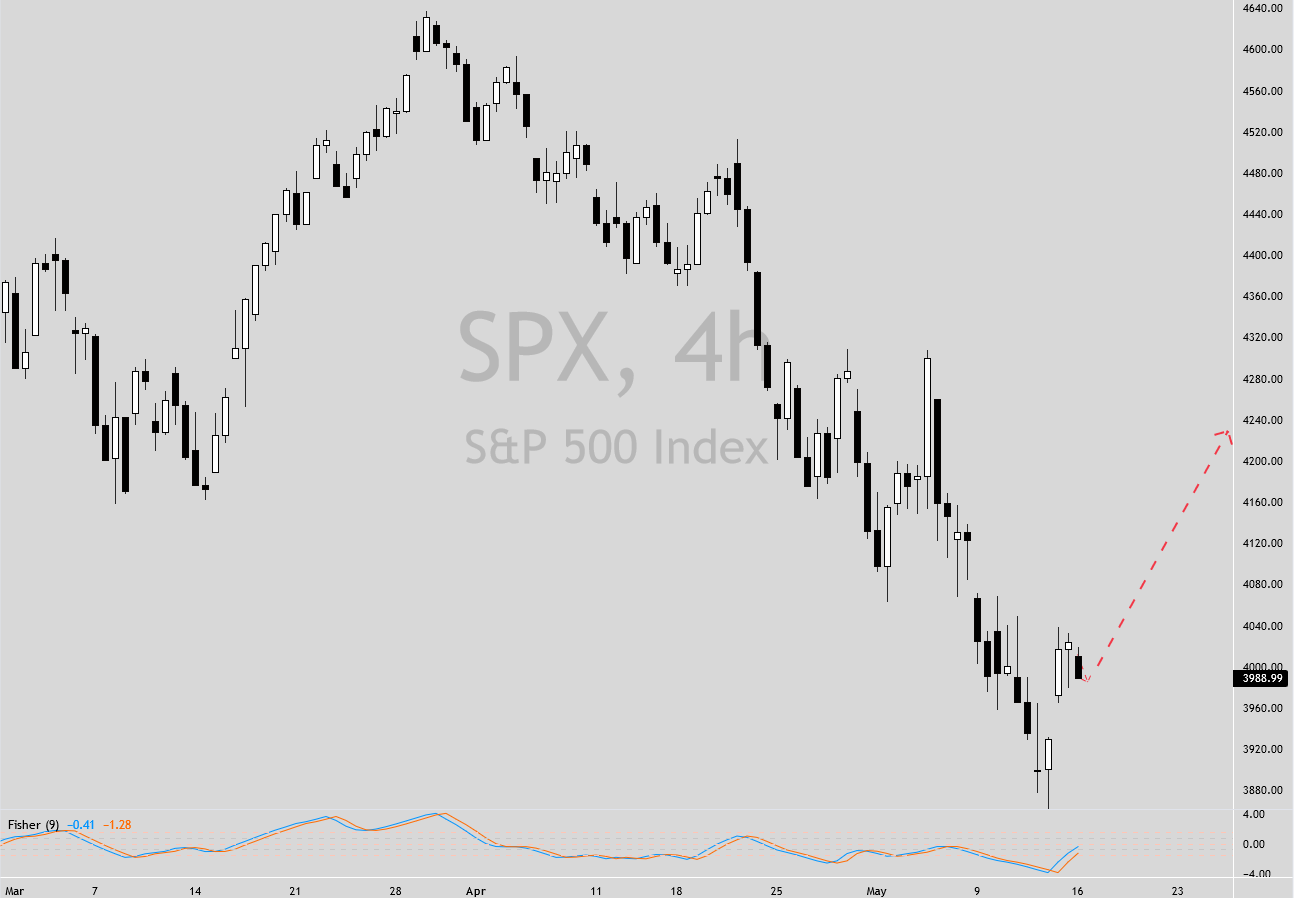
The BOTTOM IS IN for SP500 (ALERT)
PTGai triggered buy signal and anticipating UPSIDE in SPX from here. Intraday HFT bots are to the sell side but dominant cumulative volume is bullish. PTGai has detected LARGE LOT buy volume last week. THE SHORT TERM LOW IS IN for the SP500 last week at 3859. FED language is signaling aggressive policy to address inflation. Macro priced in along with geopolitcal. Watch for a ceasefire to be announced by Russia as the economic toll is not sustainable. Risk on higher time frame bigs and our short term upside target is 4230.50-4244.50. No crash.
LONG TERM OUTLOOK: Bullish
SP 500 – Technical Chart
May 5, 2022
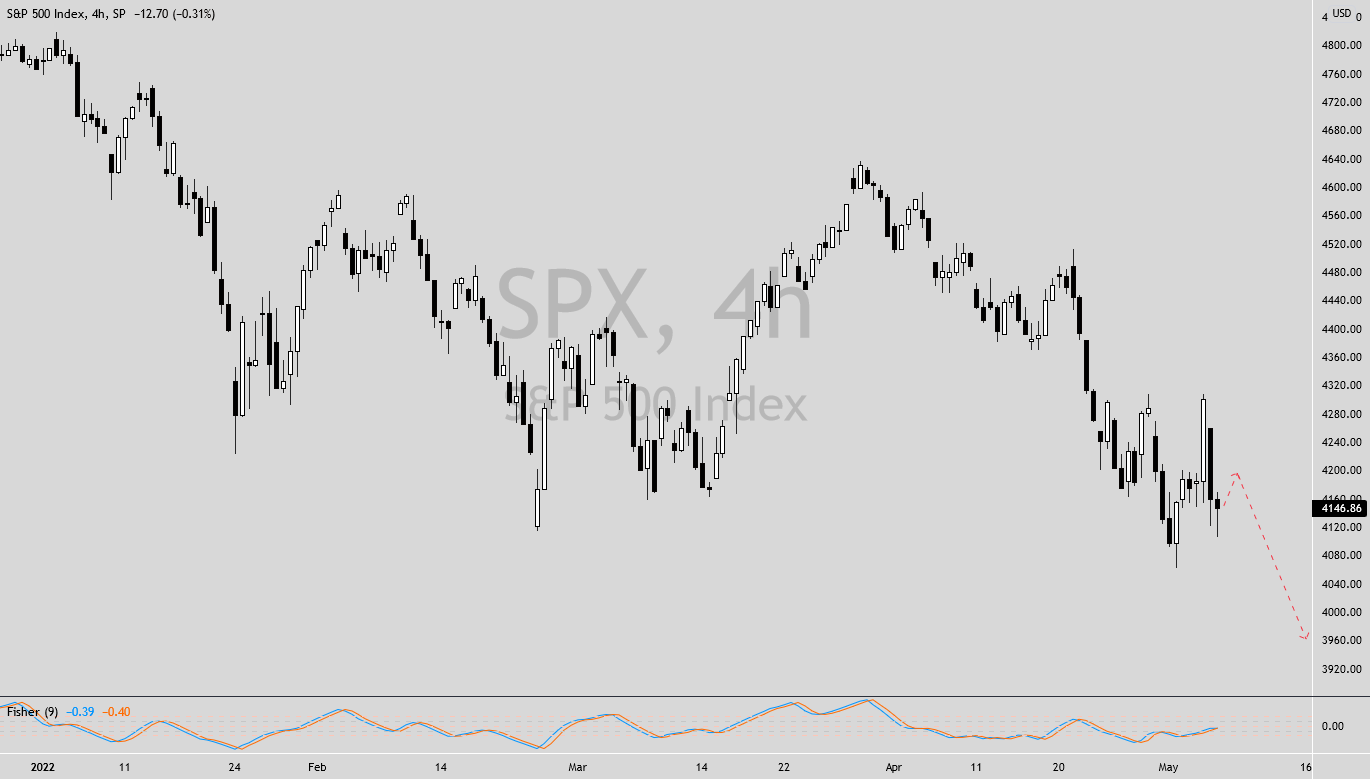
SP500 to SELL OFF to New Yearly Lows
PTGai anticipating continued downside in SPX. Intraday HFT bots are to the buy side but dominant volume is absorbing to the sell side. Tech earnings were atrocious with the sector further beaten by rate hikes and supply chain crisis. Fed rate hike of .50 signals that a .75 basis hike will likely happen for the June 15th meeting. Macro continues to be bearish along with order flow. Expect the intraday volatility to continue. Risk off continues in full effect while the war in Ukraine remains a wild card for markets. Short term downside target is 3925-3961.
SHORT TERM OUTLOOK: Very Bearish
*Update 5/11: Downside target hit, PTGai reset neutral
TSLA – Technical Chart
March 7, 2022
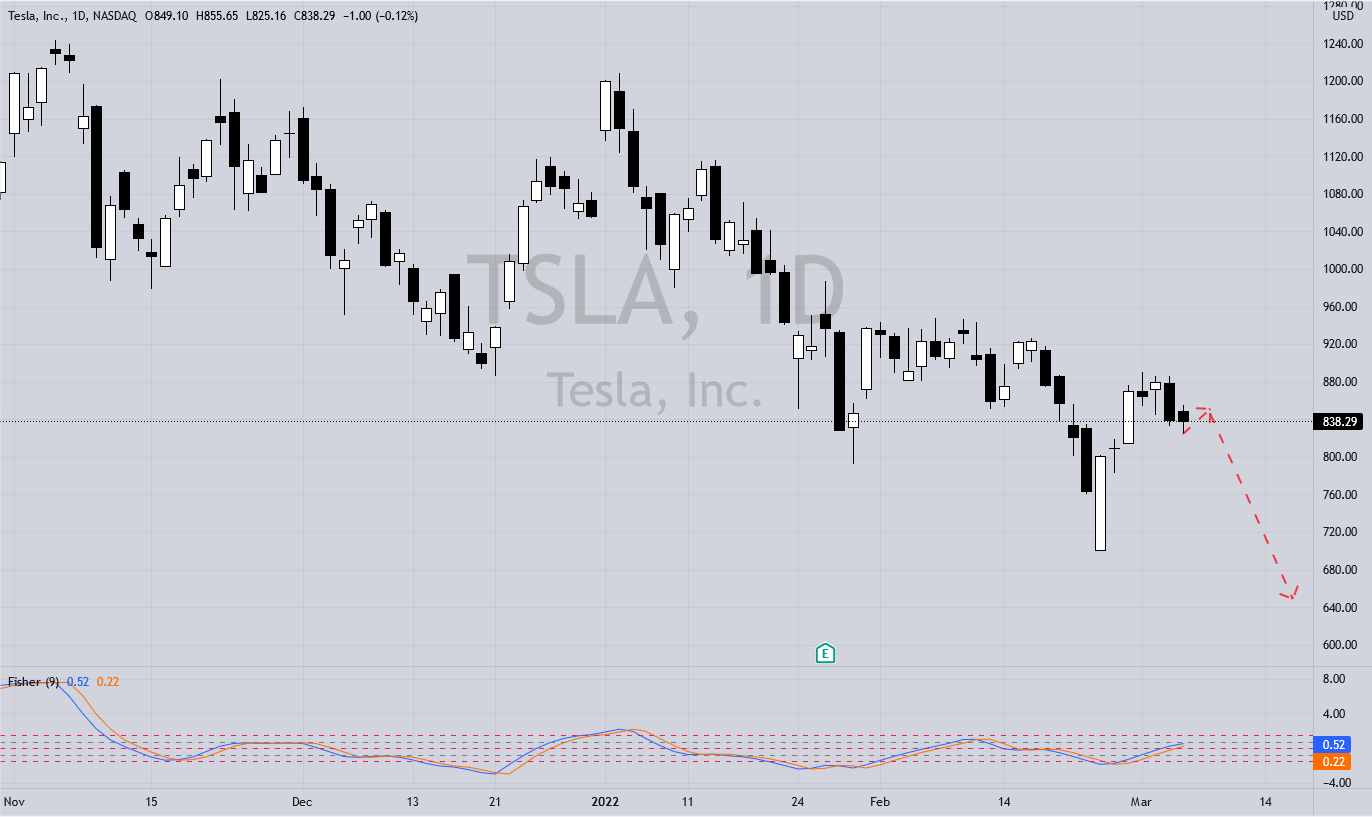
TSLA Under Pressure
Tesla is under pressure and not immune to the broader forces of an inflationary, risk off environment. Macro is simply bearish and luxury EV’s are not exempt. The P/E was rich and now being re-priced. Having called out the TSLA long trade from 700 to 881 last week, it’s important to note that liquidity levels up here are sell side. THE SHORT TERM LONG TRADE IS OVER and this move higher was simply corrective. PTGai predictive models are NOT addressing the longer timeframe thesis, that will be a follow-up post. So note that these are short term price swings that are being forecasted in TSLA. The key to having any valid discussion in a stock is to first define the timeframe in which the analysis is being made. Short term projections (trades) should not be confused with longer term ones (investments). This is likely the root of most disagreements regarding value. If there were “rules of investment conversation”, this should be one of them. Anticipating a move lower into 650 area in the short term here. Sorry Elon, sellers control it.
SHORT TERM OUTLOOK: Very Bearish
*Correction 4/29: Elon controls it.
$DXY – Technical Chart
November 1, 2021
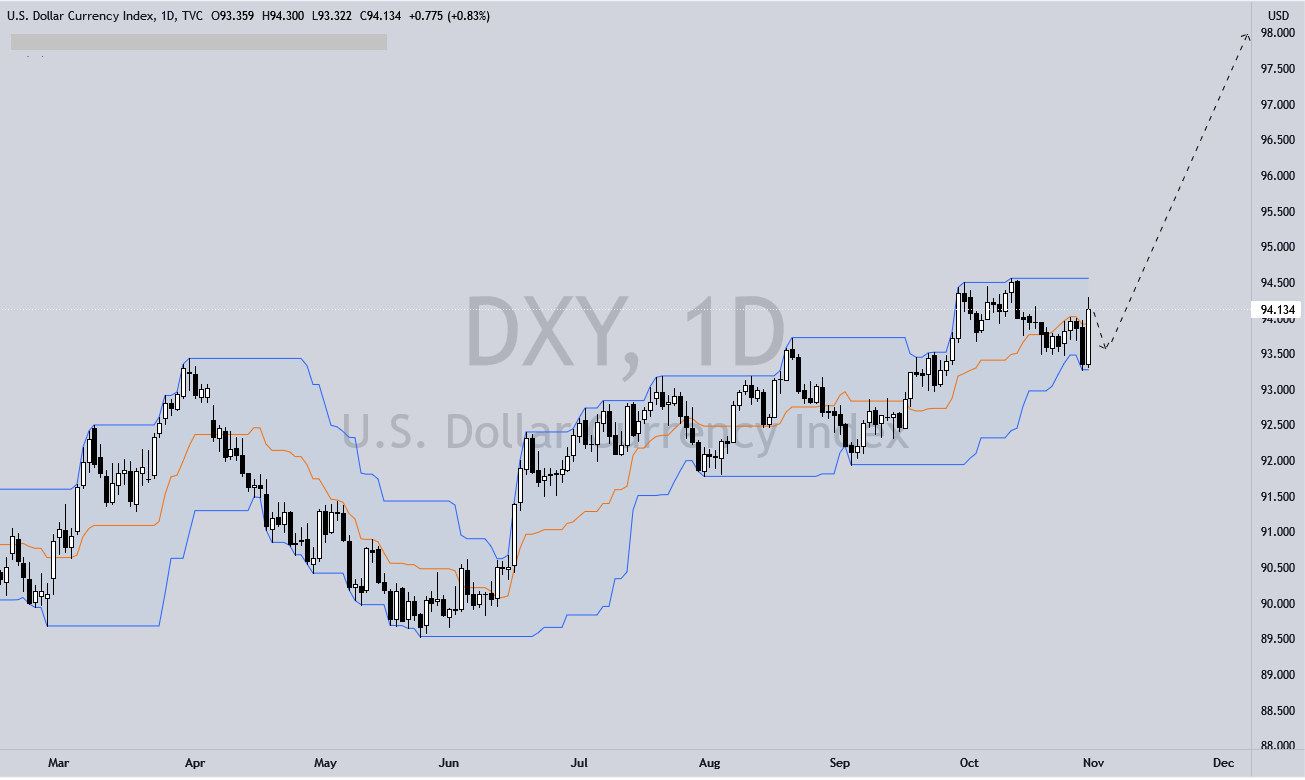
Waking Up the Dollar
With FOMC meeting this week, expect $USD to catch a bid and push much HIGHER this month. The devaluation theme will likely ease now that QE taper has become a long awaited reality. With tightening policy, FED hawkish = $USD bullish. China’s debt crisis may be contained for now but still fluid, unresolved. Expect to see volatility turned up this month with systemic issues like this and supply chain still lurking. The bond market is wonky, with short-term yields popping higher while long-term yields not following. This is resulting in a flattened yield curve. All this portends policymakers will likey make “micro-hikes” to interest rates so as not to disturb an already weak economy. Fully expecting equity indexes to push higher into end of year. The law of diminishing returns in full effect for traders/investors who have crushed it all year staying bullish equities. We are at the end of a policy cycle, and longer term investors will likely take profit at Q4 end. Upside target is 98.25 into end of month.
Netflix – Technical Chart
October 18, 2021
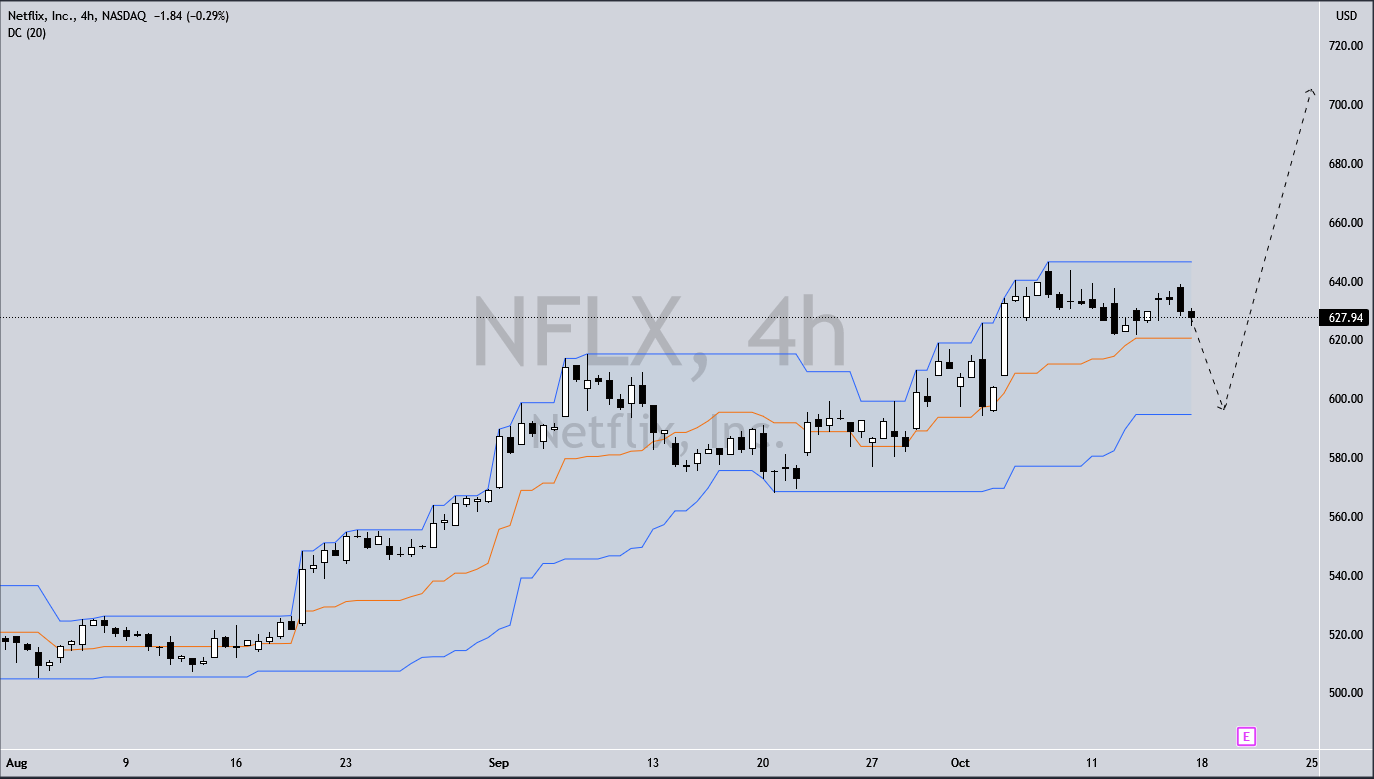
Netflix Will Crush Earnings
Netflix reports Q3 results on Tuesday and they have been doing EVERYTHING right. This will be a huge topline beat and a push up to 705+ to follow. I feel they are creating innovative, “outside-the-box” content that is targeting a growing international base of millenial viewers. This targeted approach really hooks when done right. Squid Game is the current example of this newfound creative judgement. Netflix may have even invented a theme here that can be built out into future shows. Other fresh hits like La Casa de Papel, Sex Education, and Never Have I Ever are gaining traction with this important viewer base. They are attracting viewers vertically which is the new trend in streaming content.
This is an international growth story. With only 76 million of its 209 million subscribers residing in the U.S. The arc of new subscribers are just beginning to be seen on a global level. Expect another membership explosion higher, similar to the 205M that was seen into the end of 2020. The forecast is for third-quarter earnings to be $2.55 per share. Total revenues are anticipated to be $7.47 billion. The consensus mark for Q3 revenues is pegged at $7.48 billion, suggesting 16.29% growth from the figure reported in the year-earlier quarter.
Netflix is forecasting it will add 3.5 million paying subscribers but this is super conservative. New customers surged at the beginning of the pandemic as stay at homers were looking to consume entertainment safely. As Delta hit and work-from-home became standard, new annual subs likely ripped higher as a result. Forget the mall, forget the movie theaters, and forget eating out. Order takeout, stream your favorite show and binge watch. We won’t tell anyone you skipped the gym and rocked pajamas all weekend.
How To Trade it
A pullback ahead of or on the release to 605 to 590 early in the week would be a gift. Anticipating a move higher to 705 or higher by end of week. This is an area of high liquidity where LT buyers likely add and new spec trades get taken. The trade entry here is the 680 weekly calls at 3.30 or lower.
ESZ21 – Technical Chart
September 20, 2021
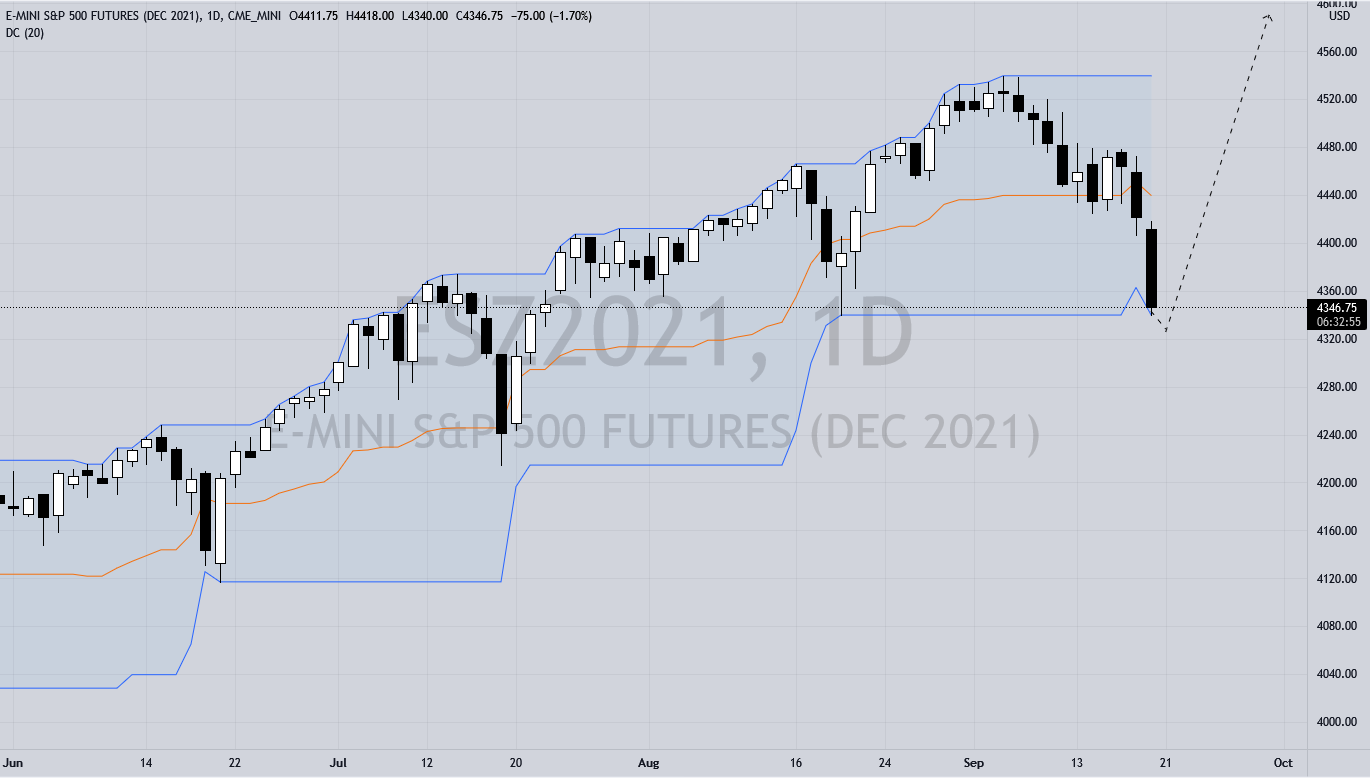
“These aren’t the droids you’re looking for…”
Anticipating volatility and expanding ranges from here. Some high-level CB decisions this week with FED, BOJ, and BOE releasing interest rate decisions. Expecting further upside in /ES this week accelerating as FED reveals tapering plans to balance sheet. This is not the LT reversal that shorts are looking for. Those shorts not closing out here will likely get trapped as new cap lift offers on the discount. High buyside liquidity at 4325-4330.50. Watching LT buyers to step in and absorb bids there. Tracking our RT signals for the innovator long. The upcoming move higher will be aggressive and high energy. Our upside targets are 4562-4571/es.
SP 500 – Technical Chart
July 28, 2021
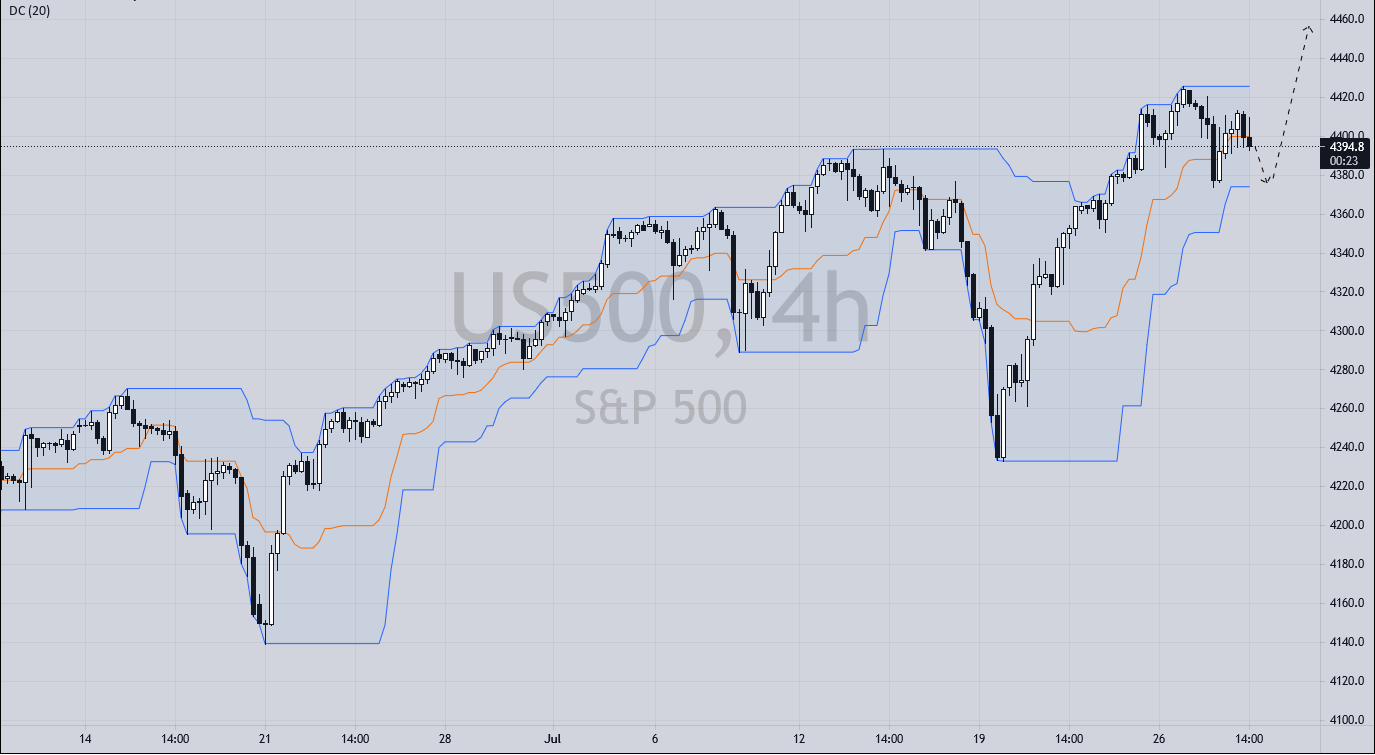
SPX is Bullish
Anticipating further upside in SP500 this week into end of month. Earnings yet to price in. That broader U.S. markets are stable despite the rout in FXI and China’s equity meltdown is positive. Capital is obviously flowing into U.S. equities as a result. Policy decision confirms the FED’s dovish stance. Powell stating ongoing vaccinations were helping to support the economy. So far, sentiment is constructive with Covid-19 mandates in progress. Upside targets of 4455-4461 spx by end of month.
EUR/USD – Technical Chart for Week of Feb.15-19
February 16, 2021
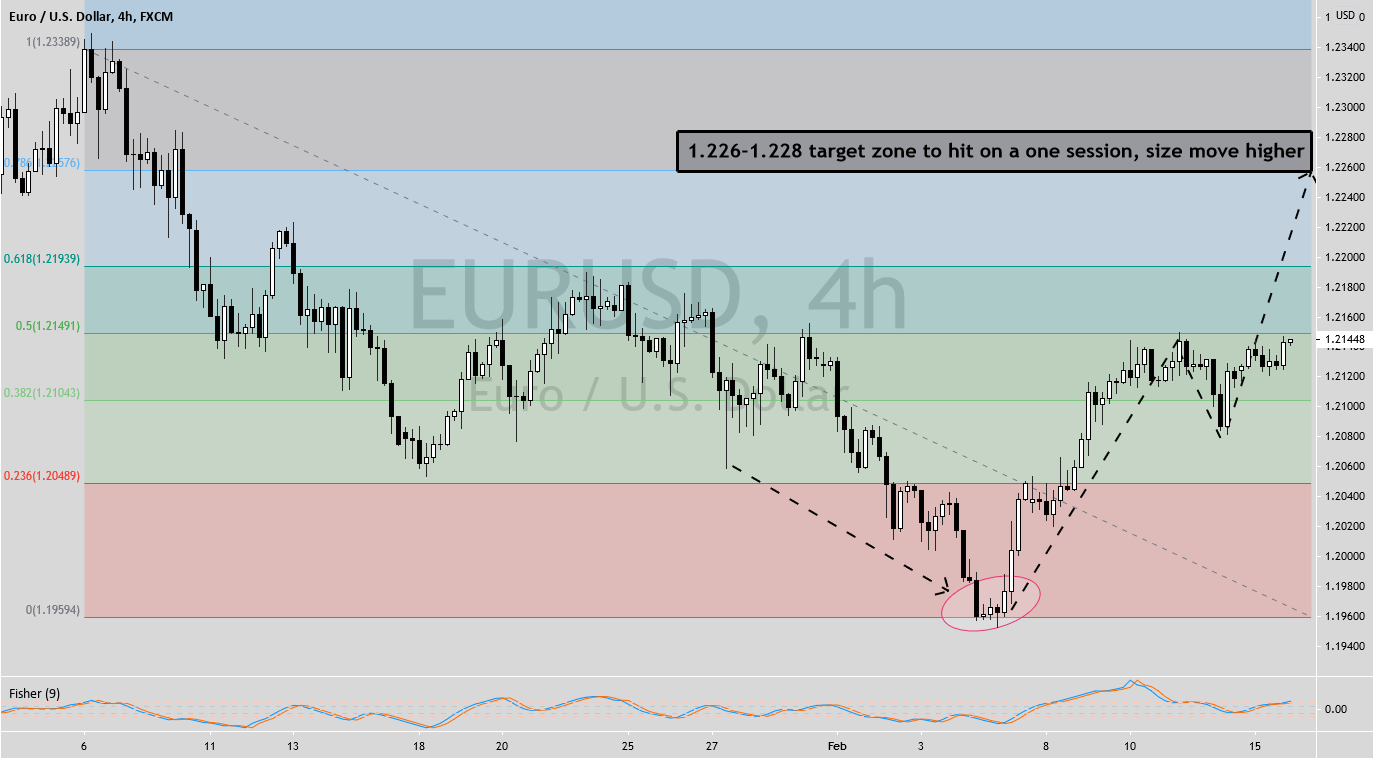
EUR/USD is Bullish
Powell reiterated his dovish stance and CB policy to remain loose with a floor now put in under EUR/USD to defend that critical 1.20 level. The $1.9T stimulus package is expected to be passed by February 22 and this is a positive change agent that is yet to be priced. The short 6E trade was massively crowded and change control is now to smart money longs. The long term BULL TREND HIGHER in EUR/USD HAS BEEN REPAIRED and now intact. I AM VERY BULLISH HERE ON EUR/USD, even more so than the S&P in its current structure. Positive volume delta gaining traction and I expect strong buyers to show up soon. Sentiment has shifted since the policy meeting.
SPX – Technical Chart for Week of Feb.15
February 15, 2021
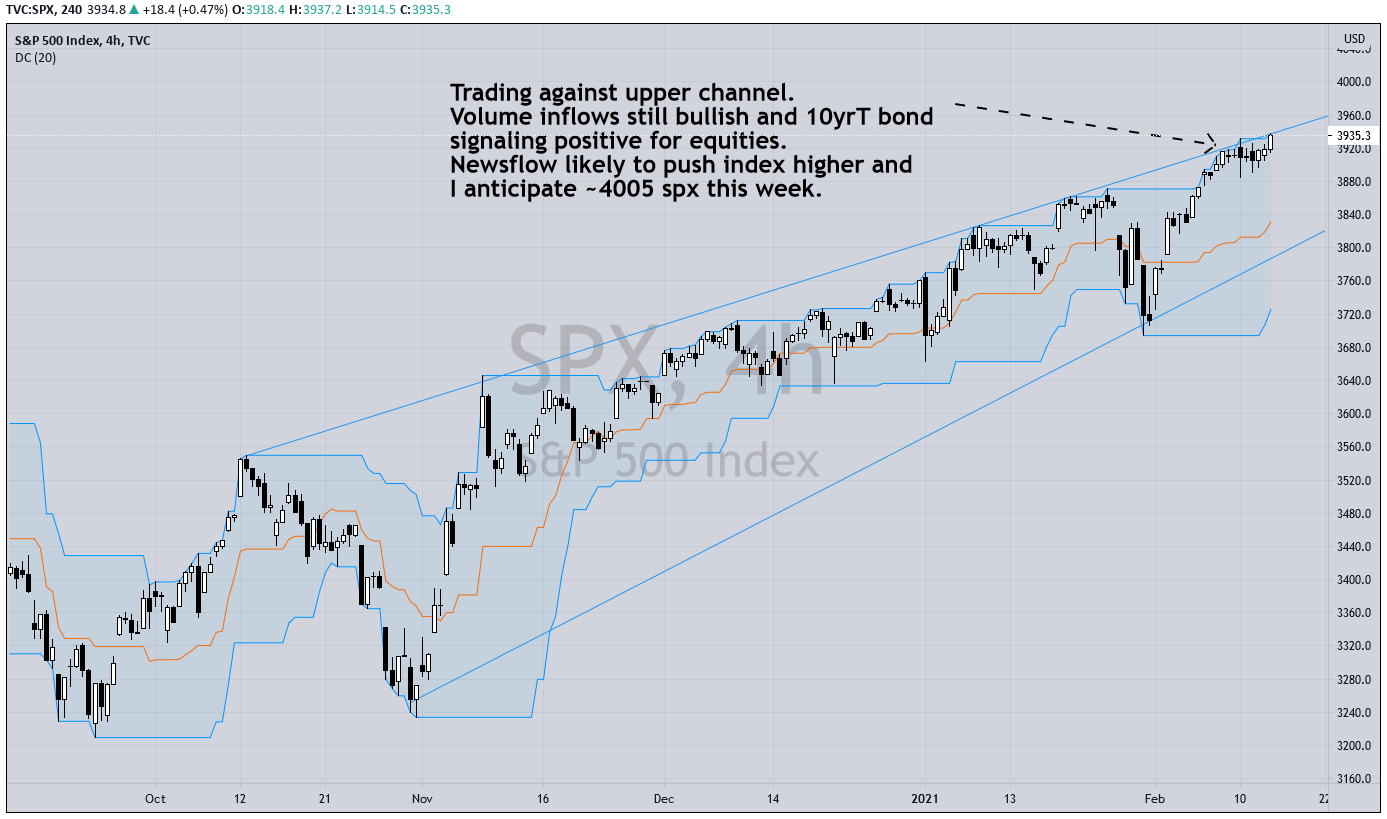
Anticipate a Push Higher to 4005 spx
Market closed for Presidents Day. Still very bullish here in a risk-on environment after Q4 earnings showed up strong. The 10yrT and bond market is just not signaling a sell off in equities despite ongoing O/B readings. Investors refreshed with the proposed stimulus still getting priced in and vaccine rollout improving immensely in both U.S. and abroad. With the Fed pulling no suprises and staying easy, investors may be getting comfortable with buying an extended market. Note that at all time highs there is no market structure and a parabolic move higher can happen. Stay vigilant, I expect volatility and ranges to spike soon. Key data for this week will be in hospitality sector and retail sales. These will be signals of economic recovery from pandemic restrictions over previous quarters.
EUR/USD – Technical Chart
January 18, 2021
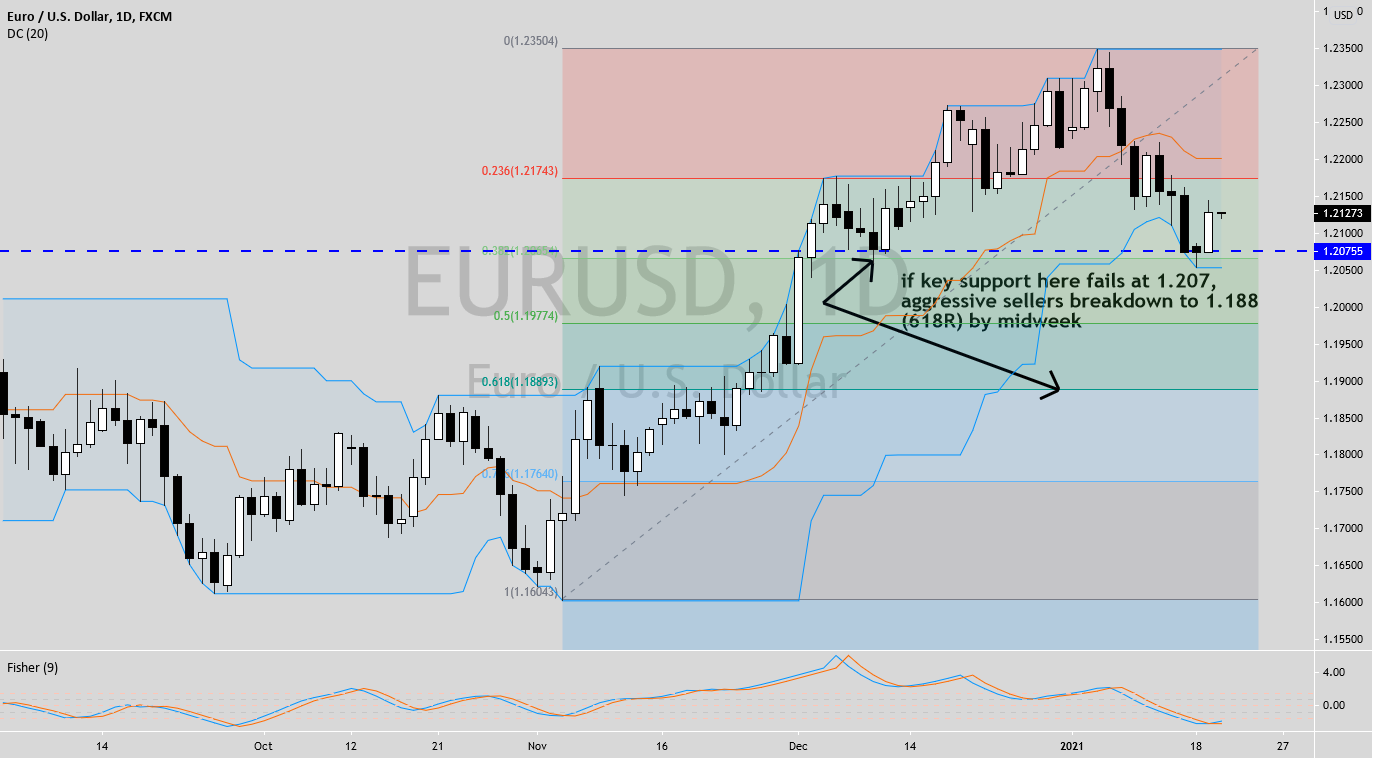
A Pullback in the Short Term
Bearish in the new year after rejecting 1.230 level. Risk averse here on weak economic growth and the sluggish vaccine deployment in the Eurozone. Expecting continued risk-off move as $USD is in a technical bounce higher also. If key support fails at 1.207 it’s likely aggressive sellers will step in to breakdown to 1.889 level. I feel this is only a minor rotation lower that will find longer term buy volume at that level. EUR/USD is currently in positive correlation with sp500. Also bearish that Biden’s $1.9 trillion pandemic relief package, the American Rescue Plan will likely get diluted by Congressional opposition and that the final version will be much lower and deficient. The resulting projection of higher taxes weighing heavy on stock prices. I believe this plan will further weaken the US dollar in the longer term, and inflation likely the continued theme for late 2021.
Bitcoin – 2020 Technical Chart
September 25, 2020
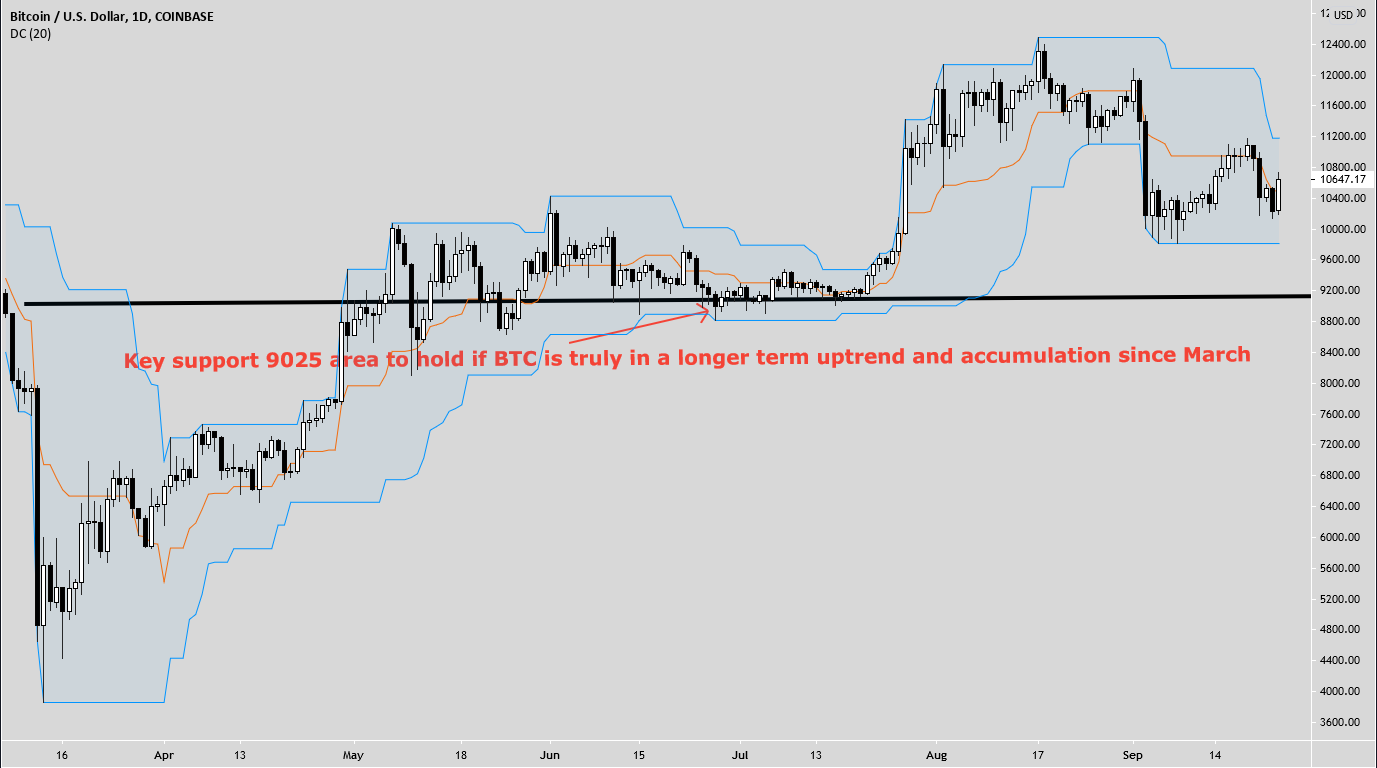
There is a time for everything, and a season for every activity
Bitcoin adoption is finally entering a new phase and correlations are being formed with fiat like USD. Price action is finally adhering to auction market theory which is the signal that value can now begin to be measured. The concept of trading Bitcoin short term has never been justified when few drivers were present and markets were illiquid. Despite past volatility, digital currency has always been a long term play. A decade long play on a store of value. I DONT SEE A BITCOIN MONTHLY CLOSE BELOW 8,200 from here and see $6,700 as a multi-generational price floor. Looking ahead, if the bulls can continue above the $10,760 level, higher resistance above at $11,500-$11,650.
Bitcoin Adoption is in its infancy
November 25, 2019

Price Does Not Always Reflect True Value
After 10 years in existence, the question of if and when mass crypto adoption occurs is still up to debate in the cryptocurrency space. Humans historically think in linear scale. Once a personal investment is made, it is in our nature to believe in a steady, linear rise higher. Against the background of a technologically exponential environment, bitcoin lends itself to allowing exponential adoption growth rates along with volatile pullbacks. To be accepted in mainstream, bitcoin gets adopted and THEN rises in value. It doesn’t get adopted because its risen in value, it RISES in value because it is adopted. This is why the bitcoin price runup of 2017 created unfair, inflated prices based upon utility as opposed to true value. It was not a sustainable fair market price, and quickly rejected. Value MUST be driven by mass usage and commensurate adoption rates, THEN go up in price. These are birth pains of a new currency self-adjusting to its respective auction market.
What is Mass Adoption?
Mass adoption means governments globally have created an enabling environment for blockchain and cryptocurrency to flourish or adopted the technology in their own practices. Mass adoption needs to be specified according to the specific use case. Mass adoption as a store of value is different from mass adoption as a payment method or mass adoption of smart contracts. Over the course of the last 10 years we have barely gone through “mass awareness.” The majority of people, in the U.S. at least, have heard of Bitcoin, and from rough estimates, perhaps 2-5% of Americans have used it. When that surpasses maybe 10%, then mass adoption has truly begun. Mass adoption of crypto would mean that its use would be an ordinary function of daily use. Mass adoption will take momentum when the general public is able to access, purchase, hold and use cryptocurrencies without having to understand the underlying technology. Just as everday people can turn on a PC without knowing or understanding how it really works inside. Current payment methods must be displaced by faster opportunities in everyday life to pay for goods and services using cryptocurrency. Global acceptance requires a safe, easy and inexpensive and reliable platform to easily transact. A number of stages are required for mass adoption of cryptocurrencies to take foothold. The first stage was awareness and the next is institutional adoption to enable institutional, political and regulatory acceptance. This second phase will require end users and institutions to transact with eachother with confidence. This process took two decades to fully develop in the case of e-commerce.
So When Do We See It?
A lot slower than the public thought two years ago during the Bitcoin mini-bubble of 2017. One key ingredient for mass adoption is liquidity and right now few marketplaces have the volume and infrastructure required. When we attempt to project growth of the crypto industry, we see three distinct market areas, each of which will have its own adoption curve. In an organic adoption cycle, grassroots awareness spreads the word, accelerating adoption in the retail world and everday users. Large scale commercial areas take notice and take action to monetize the opportunity to get first mover advantage. Banks and payments businesses need to consolidate these solutions to provide any efficient global service. This would signal adoption in the institutional segment.
This pattern is playing out textbook in cryptocurrency markets right now. In the beginning, crypto was limited mostly to techies and math aficionados. Soon after this it grew into financial speculation in the retail space. Businesses like brokerages, exchanges and payment services popped up and are now servicing this market. Right now major institutions like Fidelity, JPMorgan and other big players are servicing parts of the crypto value chain. With all three areas now on the adoption curve, we are likely moving into the second inning of mass adoption. This phase will require government regulations to accomodate the indisputable growth and provide for a safe and fair market. The historical analog here would be the development of e-commerce on top of the internet, taking 20+ years for full global adoption. Even the brightest back then underestimated the timeline. The rate of adoption for digital currency will likely be parabolic and in less than half that time as it is will be integrated as Internet 2.0
Floored: The Complete Documentary Film
August 20, 2018
The End Of An Era
This is a great historic documentary about the ups and downs of pit floor trading. It depicts the end of an era, where the transition from open-outcry to electronic trading took place. A look back to a time when traders were kings and the characters were large. Far removed from the fast, algo driven trading today.
Sell volume imbalance at the edge of a balanced auction – August 9 close
August 9, 2018
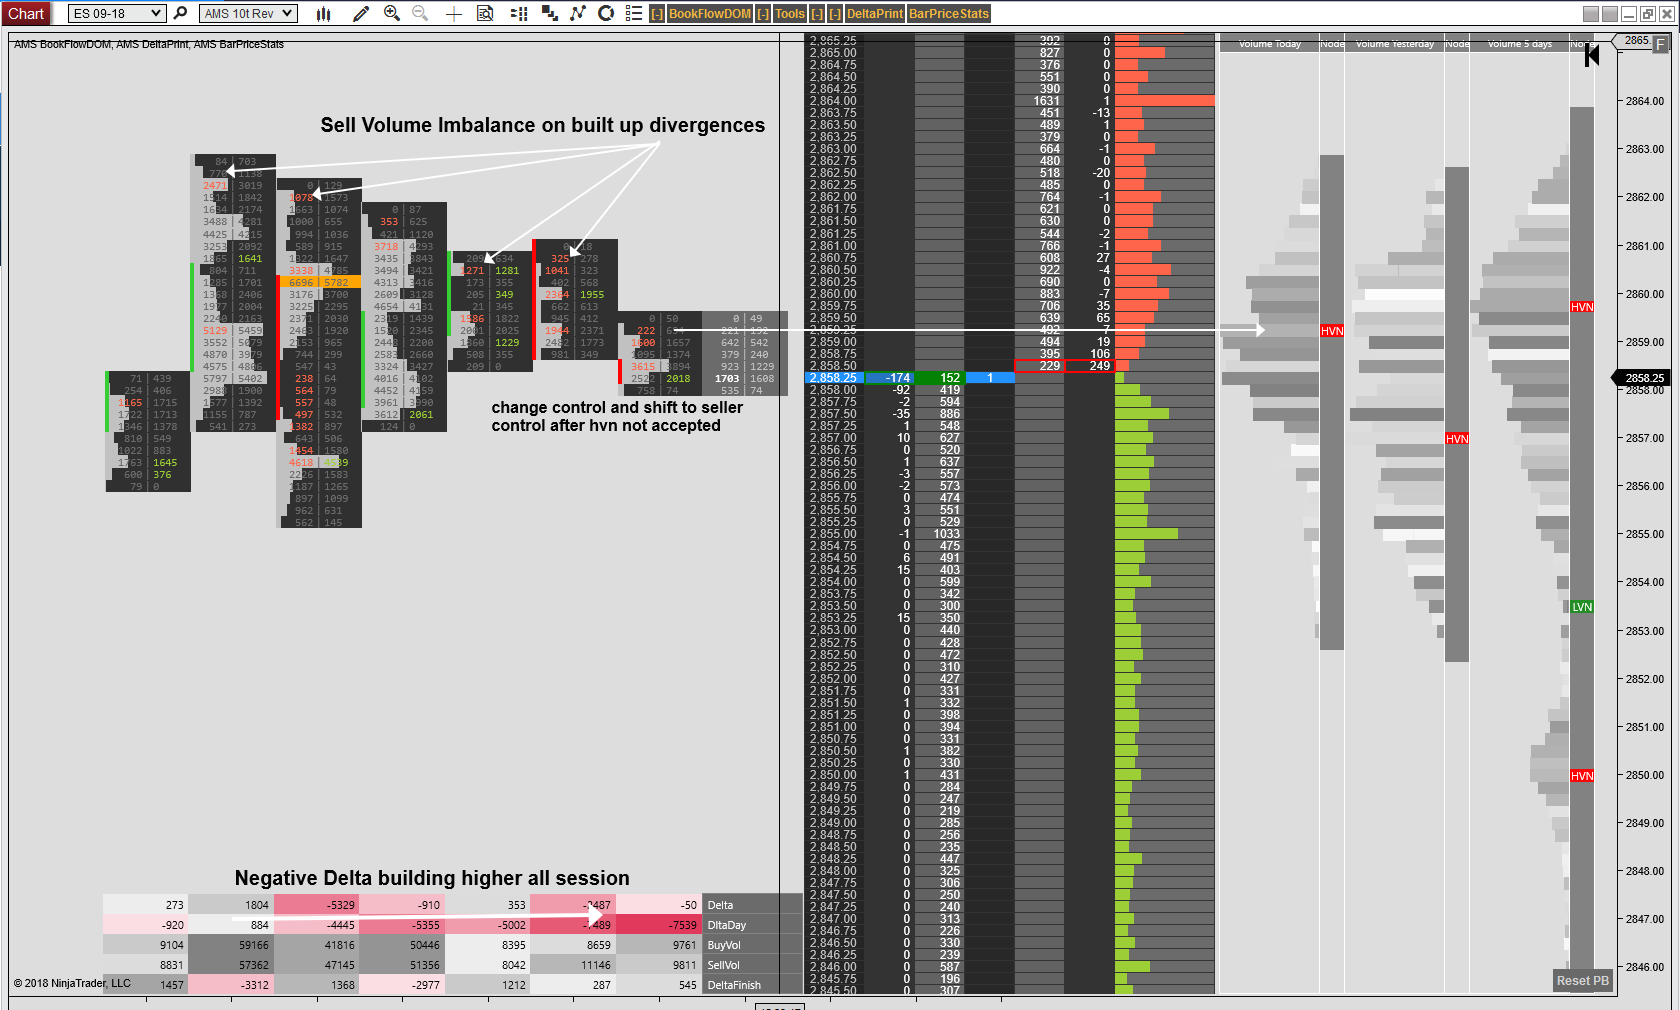
ESU18 SEP Contract
Why Price is Just a Number
These volume imbalances were built up for most of the session. While retail traders were looking for the break of resistance, the orderflow shows distribution. Net negative delta increased while price was at highs to fuel the negative divergence. A key HVN at 2859.25 was not able to find acceptance and the change control to seller control occurs shortly after. Price is advertising higher but volume revealed the true narrative.
Market Profile Composite Snapshot for ES – June 2018
June 27, 2018
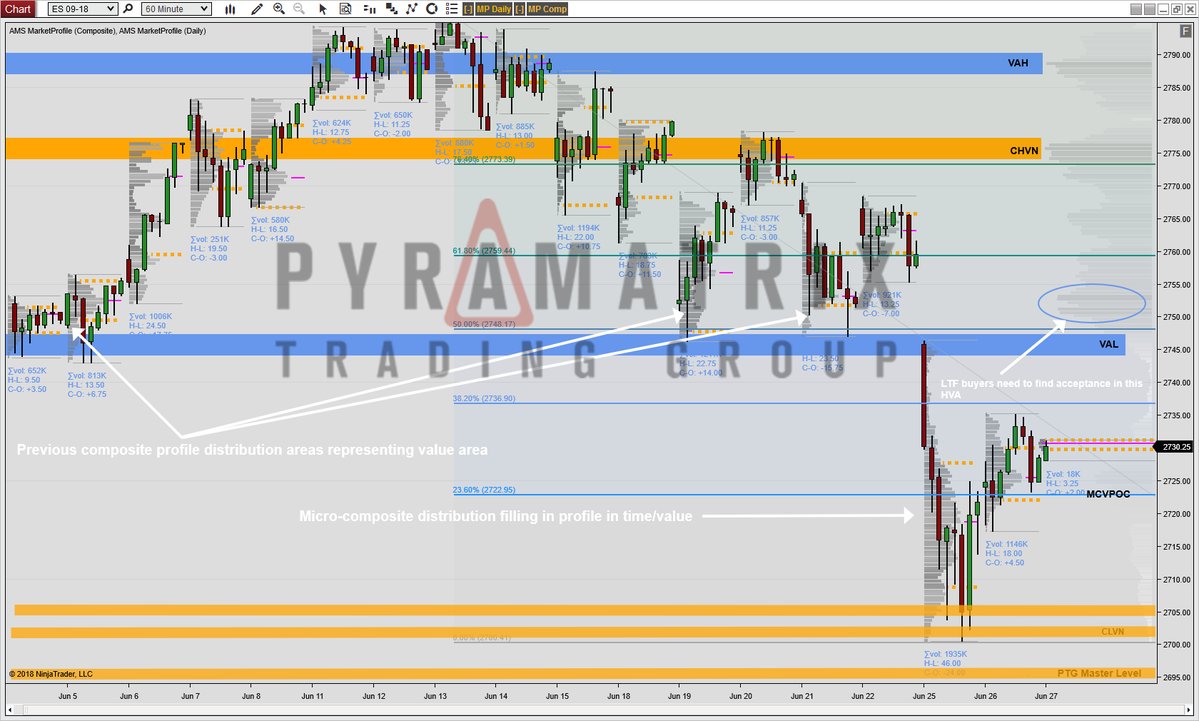
ESU18 SEP Contract
Is Risk-Off Priced In?
The market is a forward pricing mechanism and the window for price dislocations are very small. The Footprint orderflow show that sellers have been in control since mid-June. These are normal rotations in what appears to be a healthy, two-sided auction that is respecting Profile structure.
Constructive Bull Market
Note that as of Fridays session, longer term size buyers were aggressive on the offer and taking advantage of weaker longs that may have exited on the bearish newsflow that hit in mid-June. As I called out in the trading room, LT buyers are now stepping in to take the discount and attempt the drive higher into the lower composite value area starting at 2754.25. That is the narrative that seems to be playing out.
Why Smart Money is Long
With the initial onset of China tariffs and the media focus on an all out trade war with China, most of the smaller funds took risk-off into end of month. That newsflow appeared to have flushed out weak longs who appear to have taken profit after the intense scrutiny of trade between the world’s two largest economies. It appears the tipping point, at least in the short term, has been reached. The OPEC supply meetings were constructive and and CL drove higher due with Trump administration levying strict tariffs on any country that buys Iranian oil. Production was low and so there is currently negative correlation with the ES. This is definitely not a correlated market and so watching this week if correlation links positive and drives ES higher.
Why Digibyte Will Be the Standard, not Bitcoin
April 30, 2018

2019 Lamborghini Uro V-12 engine
Directions:
Choose the pair that best compares to the relationship in the example below.
Alloted Time:
1 minute
DIGIBYTE : BITCOIN
Apple : IBM
Lamborghini : Chevrolet station wagon
Peets Coffee : Folgers Coffee
disruption: status quo
all of the above
(See Answer Below)
A Faster Engine
Digibyte is a global blockchain with cybersecurity for digital payments. It is 50x times faster than Bitcoin with over 5 million blocks and 15 second block times. Digibyte (DGB) is the most decentralized mineable blockchain in the market with over a 100,000 nodes. It was the second coin to activate Segwit for atomic swaps. DGB uses five mining algorithms to prevent centralization and protect against a 51% attack. Currently, the community is discussing a hard fork which will swap out an algorithm for another to prevent ASIC -90.00% mining centralization. Yes, they are the gamechanger and everyone will hear more about them very fast. Over 4 years, DGB has become the world’s fastest, longest, and most decentralized blockchain. It is scheduled to perofrm at 180,000 transactions per second by 2035 since the block size doubles every two years. Meanwhile, Bitcoin is bogged down by 7.8% unconfirmed transactions.
A Better Designed Coin
Operational since 2014, this coin has a number of interesting functions, including advanced security protocols on top of its 15-second block time. Digibyte was first mined on January 10, 2014, has come a long way from its early days. The CEO behind this rising coin, Jared Tate, revealed that the blockchain aims to deliver a high-speed and protected virtual token to a broader audience. Supported by dual bands of developers, including pre-miners and adopters, Digibyte is gaining momentum in acceptance points and is being deployed by other decentralized systems.
A Higher Price Trajectory
In terms of the price action, Digibyte has recently touched $0.04 level, which is a landmark for this currency. Trading at $0.043 after doubling in the last month, the trading volume of Digibyte has had a steady rise. With a circulating supply of 10,172,475,033 DGB tokens. The current price correlation with the base markets has DGB increasing at a ratio of 2:1. For a legacy coin, Digibyte has a low market cap and a low per unit price. It is massively undervalued and the price projection I have for DGB is over .70-.80 by end of year.
CORRECT ANSWER: If you chose “all of the above”, you may go home now.
How Crypto is Preparing for Takeoff
March 16, 2018

“We were working in a complete vacuum as to information based upon prior performance and prior design.”
–Howard Hughes
A Leader Will Emerge
In order for newly designed planes to have taken off, better runways had to be built in response to the innovation. In order for virtual currency to take off, reliable infrastructure and exchanges need to be built to support the demand. There is no analog for an auction market with the initial, high volume transaction requirements that virtual currency has launched off with. The largest exchanges right now are Coinbase and Binance and they are facing this temporary dilemna of reliability which has morphed into a P.R. nightmare of sorts for the crypto space. Both are a large part of the ecosystem right now and the community is looking at them at a critical time when coin technology is currently ahead of the exchange infrastructure to handle transaction volume. Scalability is a good problem to have though since it is borne out of demand for expansion. The exchanges may not yet be aware of their influence and that their direction can shape the entire marketplace globally. They will have to assume that role of leadership since most other exchanges are looking to them to set the bar for expectations in what is expected and an acceptable model for the crypto community of traders and investors. They are being relied on for something larger than there own revenues and will be forced into the role of working to define the new ecosystem and industry.
Why the timing of the G20 Meeting Matters
Japan will be calling on G20 members to concentrate on developing anti-money laundering (AML) strategy for cryptourrency on March19-20. From a global perspective, this is a systemic remedy that will benefit cryptocurrency infrastructure and improve the speed of mass adoption. The fact that cryptocurrency is dropping in price into this huge catalyst is likely why larger investors are taking notice of this setup.
The Art of Being Greedy When Others are Fearful
As BTC/USD is dropping below 8,000, billionaires Jack Dorsey and Peter Theil are seeing the opportunity of this massive discount and are buying Bitcoin at these levels. Founders Fund, run by Thiel, bought about $15 million to $20 million of dollars in bitcoin for their portfolio and is supporting it as a “digital store of value” and calling it the equivalent of online gold. Technically, the BTCUSD graph appears to be putting in a “W” pattern which would confirm a long-term bottom could be in formation.
Regulation is Good For Virtual Currency
February 12, 2018

“If I had asked people what they wanted, they would have said faster horses.” – Henry Ford
Creating and Leveling the Playing Field
Every big industry has benefitted from regulation throughout the 20th century. The automobile industry, airline industry, food industry, manufacturing industry, and agriculture industry went through major regulation spurts borne out of a need for consumer safety and protection. So in the financial services industry, regulation on Virtual Currency (VC) should not be viewed as a negative, but as providing legislation, safety, and security that will allow new investors who are waiting on the sidelines to enter into the space. After the Senate Banking Committee hearing last week, both CFTC and SEC have acknowledged VC as an alternative currency that will soon have a legitmate role in our monetary system. Both agencies have the back of respectable coins and are looking to promote growth and development for it. As of now, they are still classifying VC as to whether it will be a commodity, a security, or a currency.
The most important statement from the Congressional Testimony:
“This simple approach is well-recognized as the enlightened regulatory underpinning of the Internet that brought about such profound changes to human society. During the almost 20 years of “do no harm” regulation, a massive amount of investment was made in the Internet’s infrastructure. It yielded a rapid expansion in access that supported swift deployment and mass adoption of Internet-based technologies. Internet-based innovations have revolutionized nearly every aspect of American life, from telecommunications to commerce, transportation and research and development. [“Do] no harm” was unquestionably the right approach to development of the Internet. Similarly, I believe that “do no harm” is the right overarching approach for distributed ledger technology.” – J. Christopher Giancarlo, CFTC Chairman