Bitcoin – 2020 Technical Chart

Bitcoin – 2020 Technical Chart

September 25, 2020

There is a time for everything, and a season for every activity
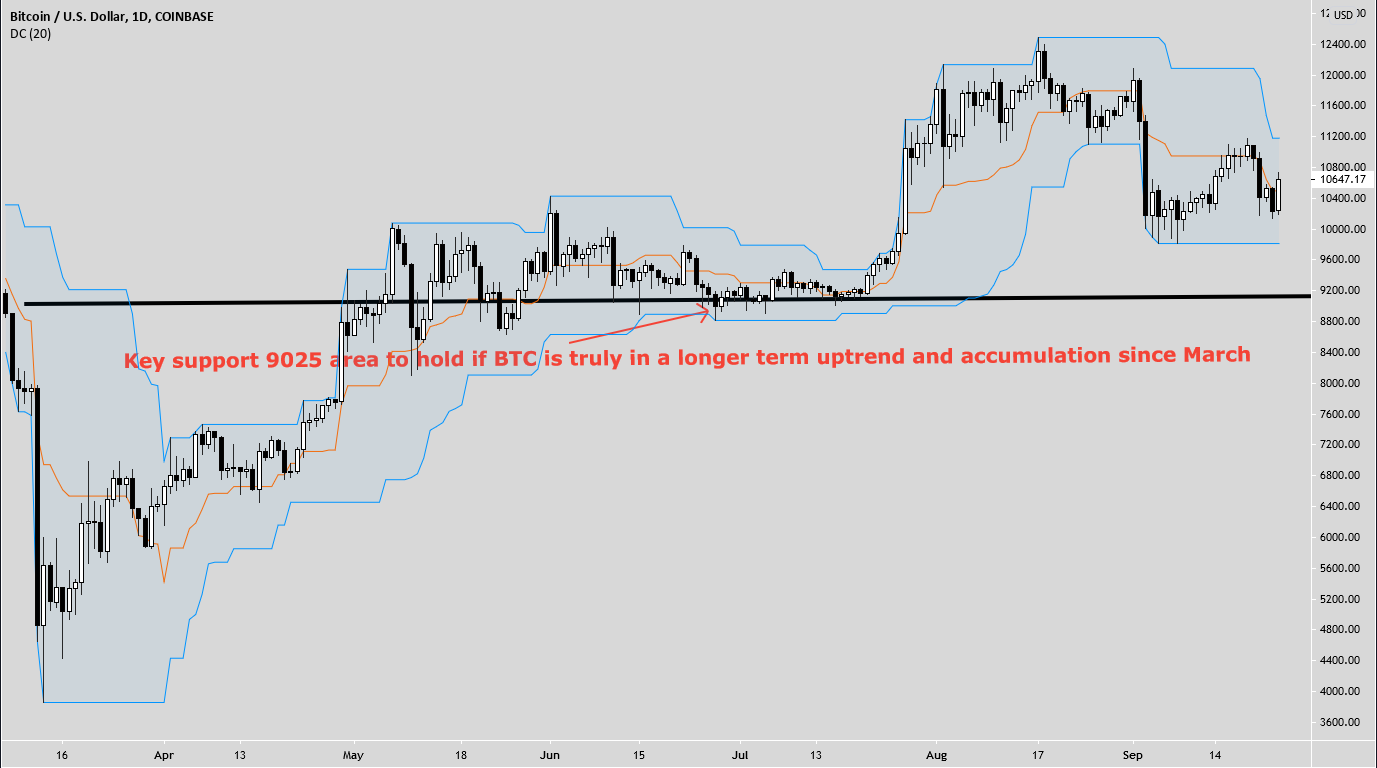
Bitcoin adoption is finally entering a new phase and correlations are being formed with fiat like USD. Price action is finally adhering to auction market theory which is the signal that value can now begin to be measured. The concept of trading Bitcoin short term has never been justified when few drivers were present and markets were illiquid.  Despite past volatility, digital currency has always been a long term play. A decade long play on a store of value.  I DONT SEE A BITCOIN MONTHLY CLOSE BELOW 8,200 from here and see $6,700 as a multi-generational price floor.  Looking ahead, if the bulls can continue above the $10,760 level, higher resistance above at $11,500-$11,650.

Leave a Reply

Your email address will not be published. Required fields are marked *